Data Model Diagram
Introduction
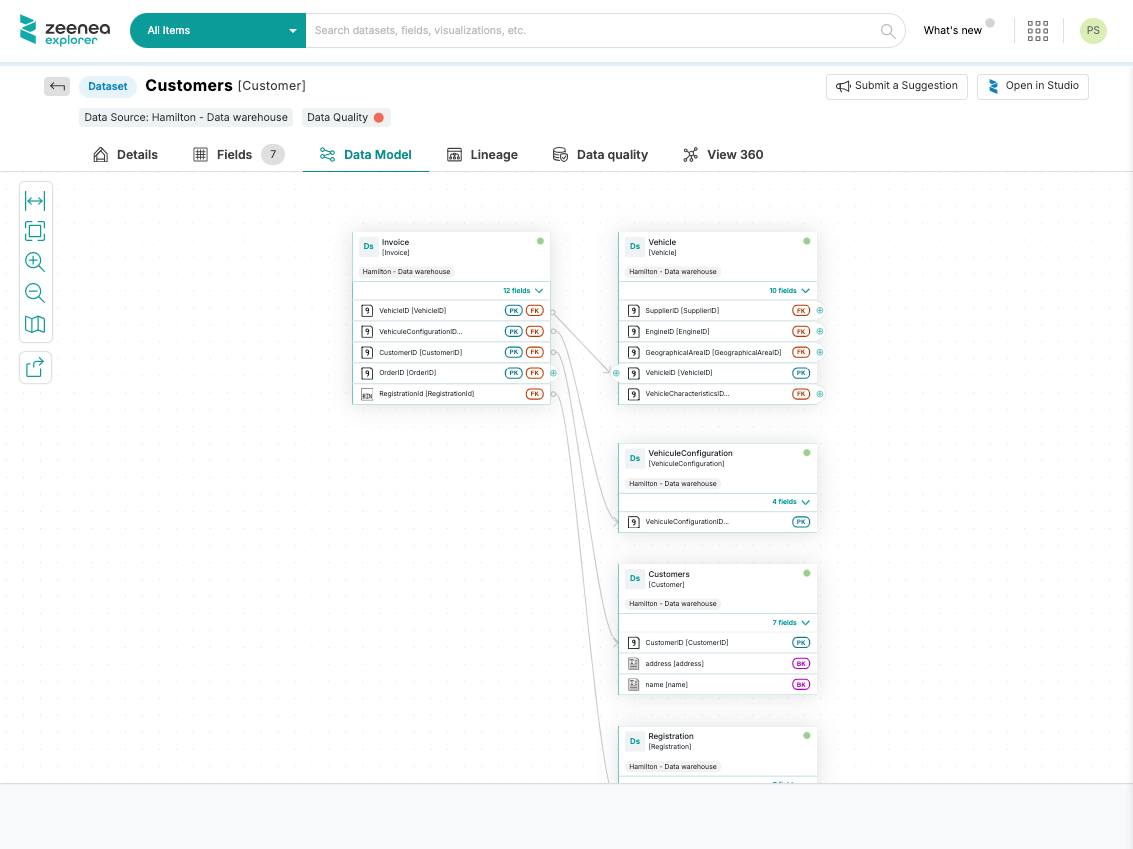
The diagram displays relationships between datasets in their own database. It helps users better understand how the database is organized with the help of the links between its items in order to let you better exploit your data.
This diagram is accessible from Studio and Explorer under the Data Model tab:
Creating a data model
The Data Model is automatically created based on primary and foreign key information in the database. This information is brought up by the connector or pushed into Zeenea using the Catalog API.
Opening an Item overview
By clicking on a dataset, a field, or a link, an overview panel will display more detailed information about the Item or the relation.
Expanding the graph
Only the first level of relations is displayed by default when the graph contains many nodes to keep the graph usable. To expand the graph and show more relations, click the "+" button in front of a field.
Zooming in and out
Use the buttons in the bottom right corner of the display to adjust how the diagram is shown.
The map button can be used to navigate within the data model easily.
Exporting the graph
In the top right-hand corner, the export button will let you download the diagram as a PNG file.