Data Profiling
Data Profiling allows you to understand a data sample better, in order to more easily detect issues, risks, and general trends related to Data Quality. It hence converts data into key insights.
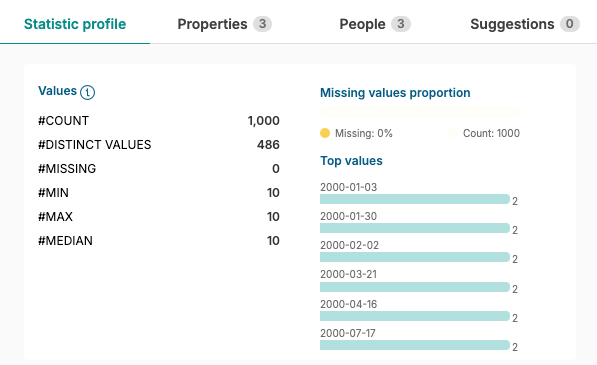
These insights are displayed graphically for each field of a dataset and will show information such as:
- Top values*
- Number of values for each field**
- The mean*
- The minimum*
- The maximum*
- The median*
- The standard deviation
- Data distribution***
- etc.
* Approximated through a sample
** Only the number of values in a field is an actual statistic
*** Box-plots and bar charts are only available for numerical values
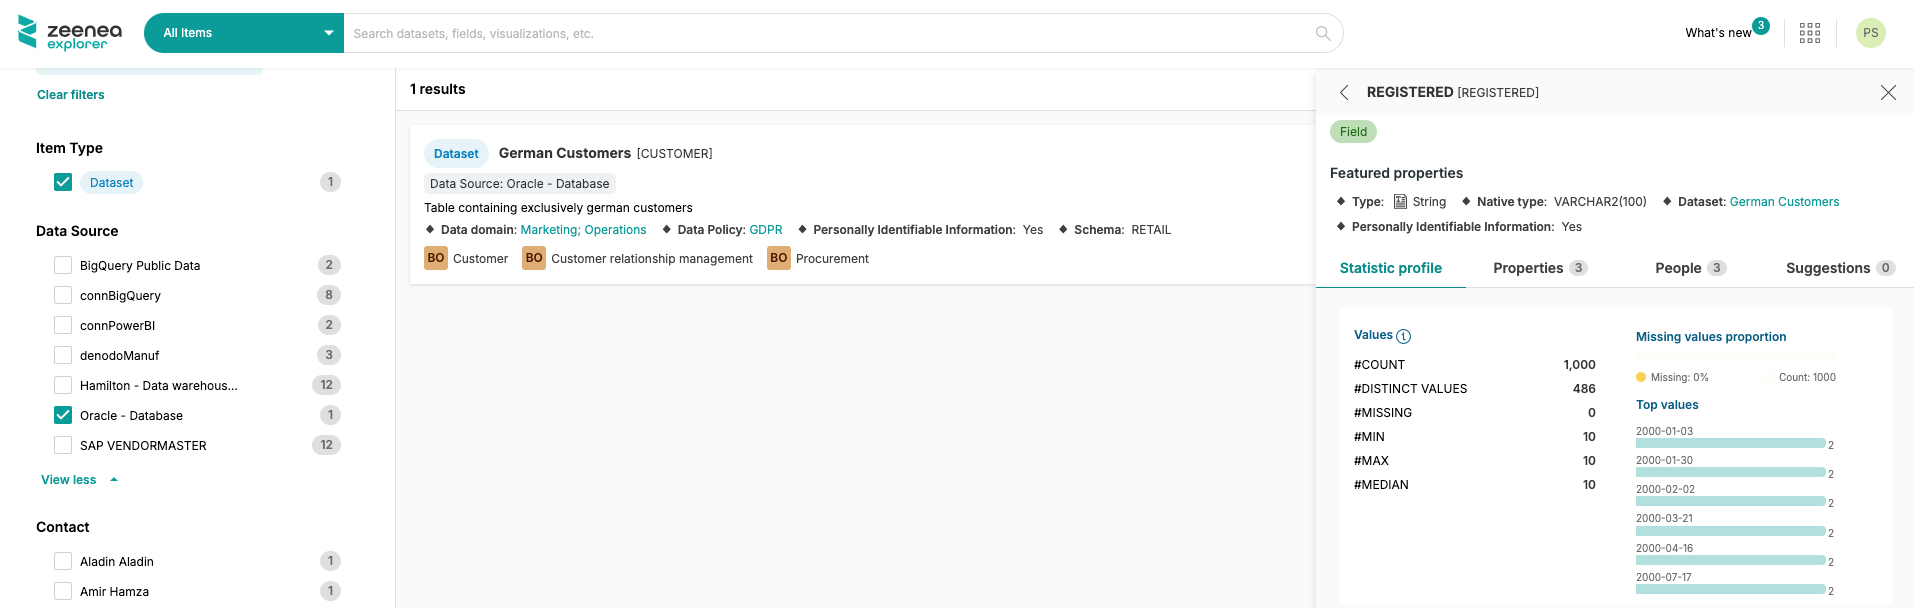
Available Graphical Analysis
Progress Bar
This chart shows the proportion of empty values compared to the number of counted values.
When there are multiple missing values inside a field, the bar is then coloured in bright yellow, enabling you to quickly identify the issue.
Horizontal Bar Charts
These charts will display the 6 most common values in a text-type field.
These are the most common in the sample, not in the entirety of the field.
Vertical Bar Charts
These charts will show how the data is distributed in numerical fields. They provide information on the total value amount, spread from the minimum value to the maximum one.
Box plots
Box plots give a comprehensive view of statistical information, simply and visually. They complement vertical bar charts.
They especially focus on the first and third quartile as well as the median. The whiskers themselves are calculated by multiplying the IQR (Inter Quartile Range) by 1.5.
If the data doesn't extend beyond their extremities, then the whiskers take the minimum and maximum value of the data.
Enabling Data Profiling
For the Data Profiling feature to work, you will need to make sure of the following:
-
The source, as the fields you wish to run the Data Profiling on, are compatible (cf. "Data Profiling-compatible technologies")
-
The scanner has been set up with the necessary permissions to extract a data sample
-
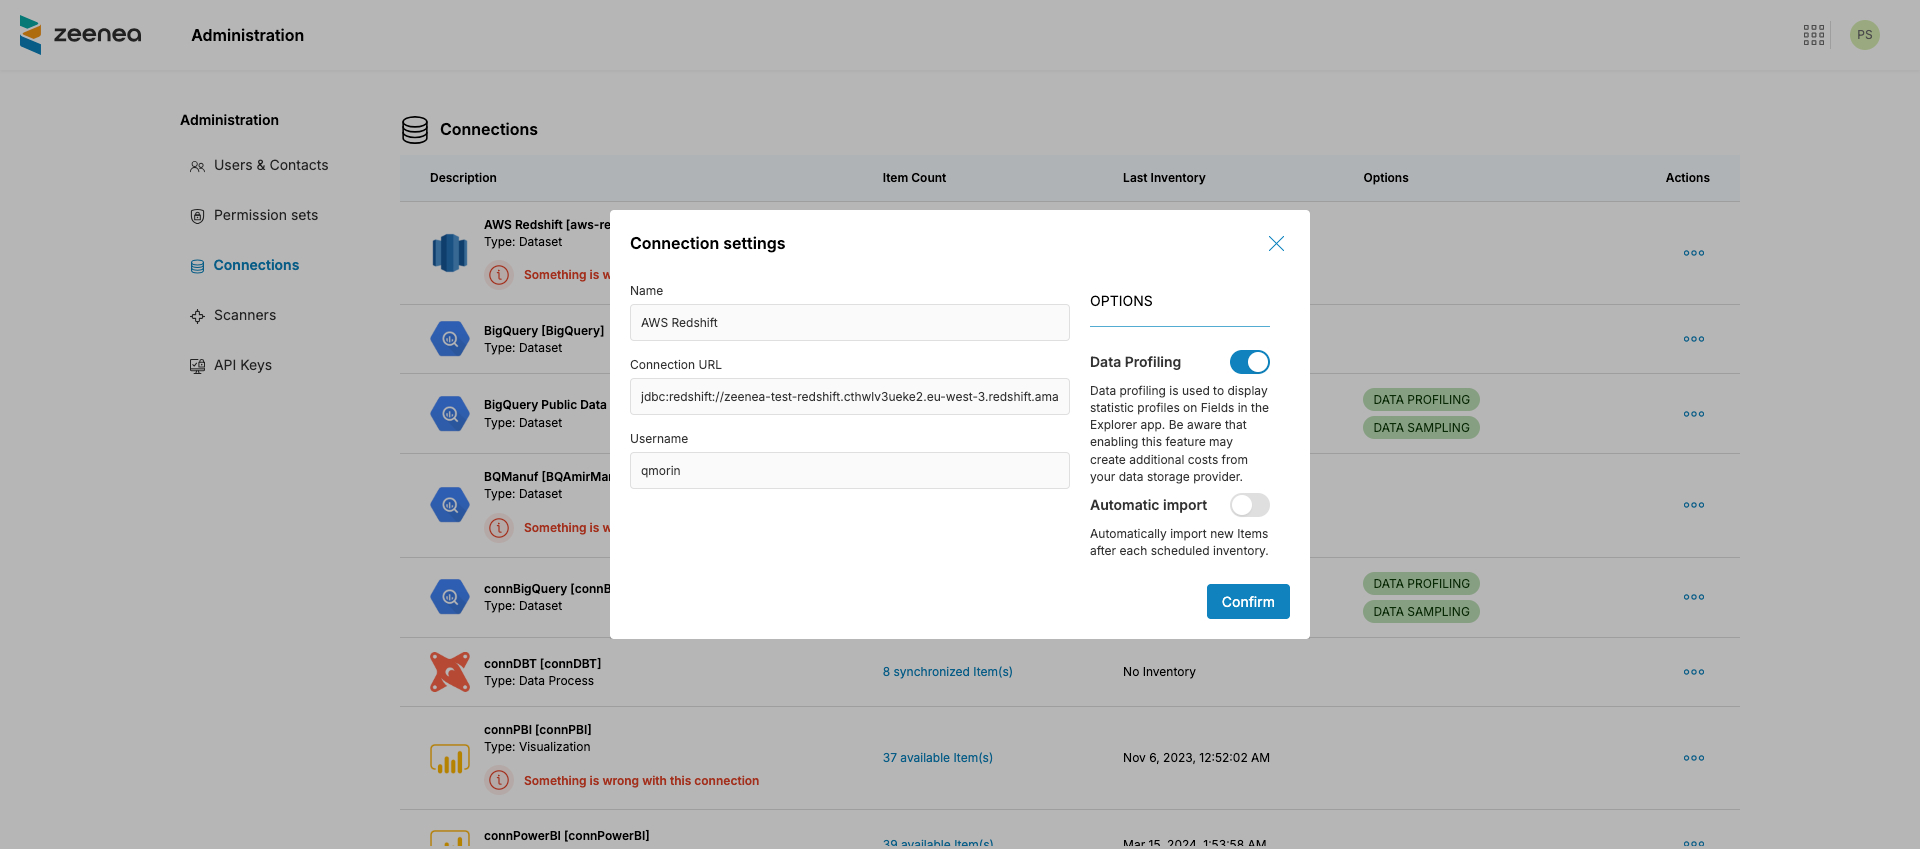
The Data Profiling on the connection itself has been activated
-
Data Profiling has been enabled in every field where it is relevant. This is done by Data Stewards, on Zeenea Studio, using the option "Activate Data Profiling for this Field".
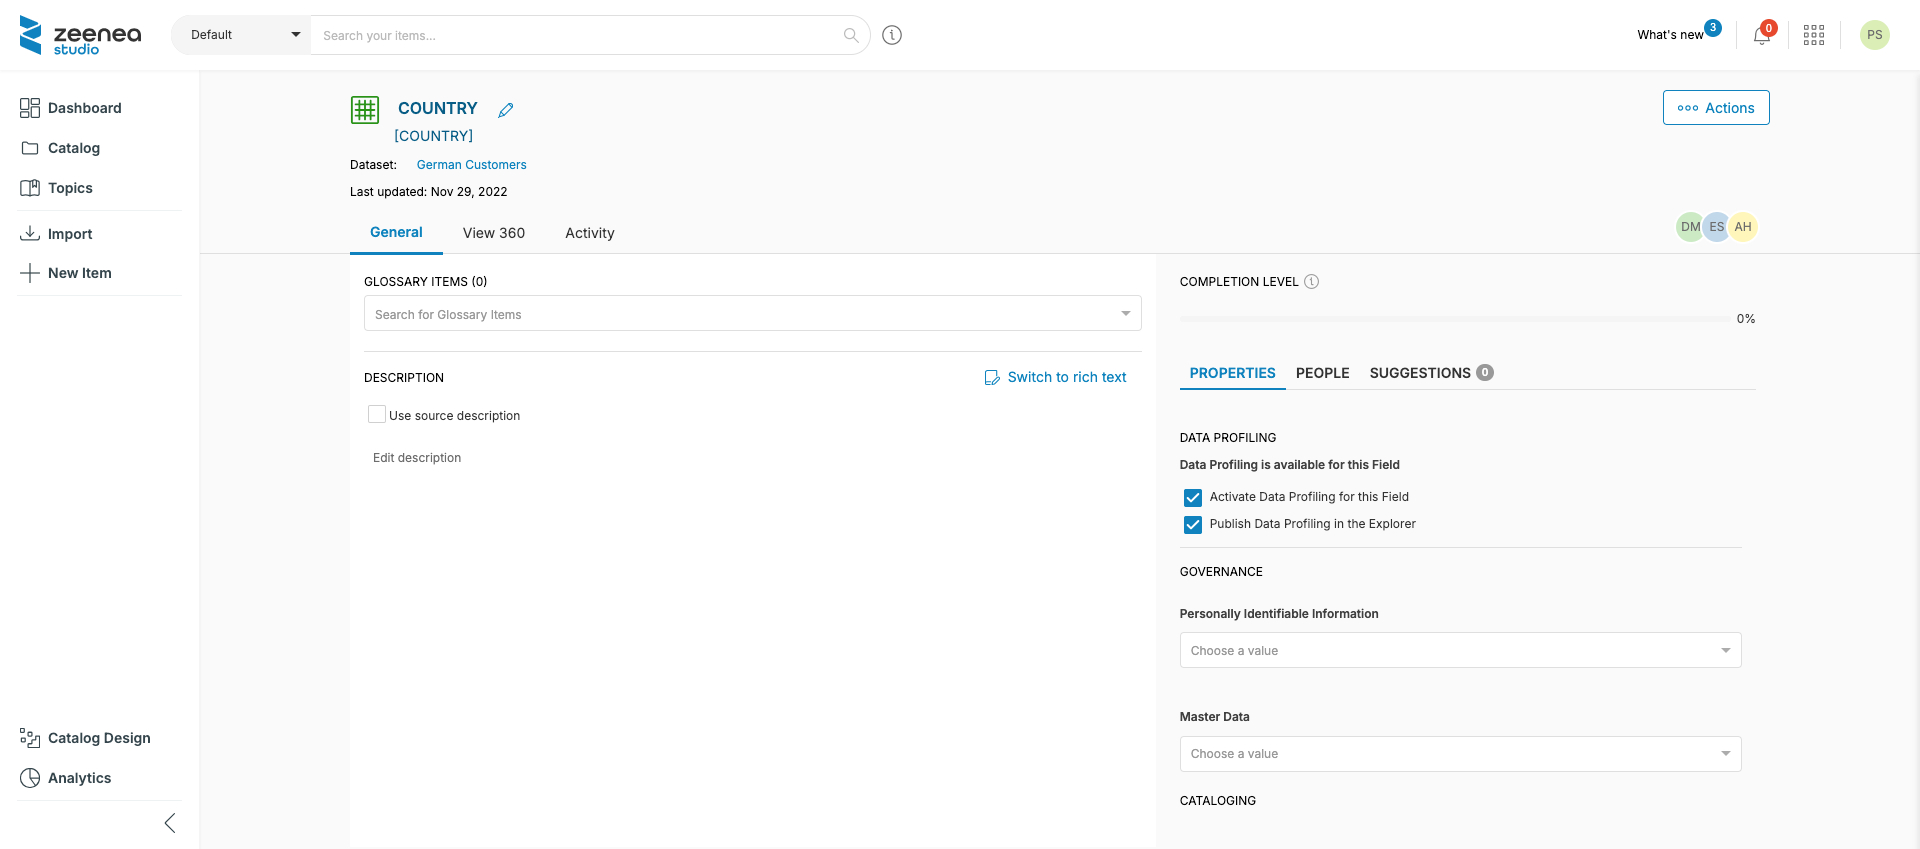
In the image above, the option "Publish Data Profiling in the Explorer" will allow your Data Explorers to have access to the various charts for each specific field.
How to manually execute a Data Profiling job?
Data Profiling is automatically run based on the connector's configuration. However, it is possible for admins to manually launch the job from the Connections page in the Zeenea Admin interface.
Data Profiling-compatible technologies
This feature is available for the following connectors:
- BigQuery
- Greenplum
- PostgreSQL
- AWS Redshift
- Snowflake
- SQL Server
- DB2
- Oracle
- Netezza
- Teradata
For each connector, below is the list of fields available for Data Profiling:
| Connector | Supported types |
|---|---|
| BigQuery | INT64FLOAT64STRING(mode != REPEATED) |
| Greenplum AWS Redshift Snowflake Sql Server | INTEGER SERIALSMALLSERIAL TINYINTSMALLINT MEDIUMINT INTYEAR MONTH DAY HOURMINUTE SECOND INT2 INT4TINYINT\(([0-9]*)\) if $1 > 1BIGINT INT8 BIGSERIALFLOAT BINARY_FLOAT FLOAT\(([0-9]*)\)DOUBLE REAL DOUBLE PRECISION BINARY_DOUBLECHAR VARCHAR VARCHAR2TEXT ENUM SET NCHARNCHAR2 NVARCHARNVARCHAR2 NTEXT CLOBNCLOB CHARACTER VARYING\([0-9]*\) VARCHAR\([0-9]*\)NVARCHAR\([0-9]*\)VARCHAR2\([0-9]*\)NVARCHAR2\([0-9]*\)CHARACTER\([0-9]*\) CHAR\([0-9]*\)NCHAR\([0-9]*\) NCHAR2\([0-9]*\) |
| PgSql | int4int8 oid tid xid cid oidvectortxid_snapshotfloat4float8char name text json xml bpcharvarchar |
| SqlDb2 | INTEGERBIGINTREALDOUBLECHARACTER si CODEPAGE=0VARCHAR si CODEPAGE=0CLOB GRAPHIC VARGRAPHICDBCLOB XML |
| DsnDb2 | INTEGERBIGINTREAL FLOAT si LENGTH=4DOUBLE FLOAT si LENGTH=8DECFLOATCHAR VARCHAR LONGVARGRAPHIC VARG VARGRAPHLONGVARG CLOB DBCLOBXML |
| Oracle | BINARY_FLOATBINARY_DOUBLE FLOATCHAR CLOB NCHAR NCLOBNVARCHAR2 VARCHAR2 |
| Netezza | INT4 _INT4INT8 OID TID XIDCID OIDVECTORFLOAT4FLOAT8CHAR NAME TEXT BPCHARVARCHAR NCHAR NVARCHAR |
| Teradata | DH DM DS DY HM HS HR I MIMO MS SC YM YRI8FCF CO CV JN XM |