View 360 Diagram
Overview
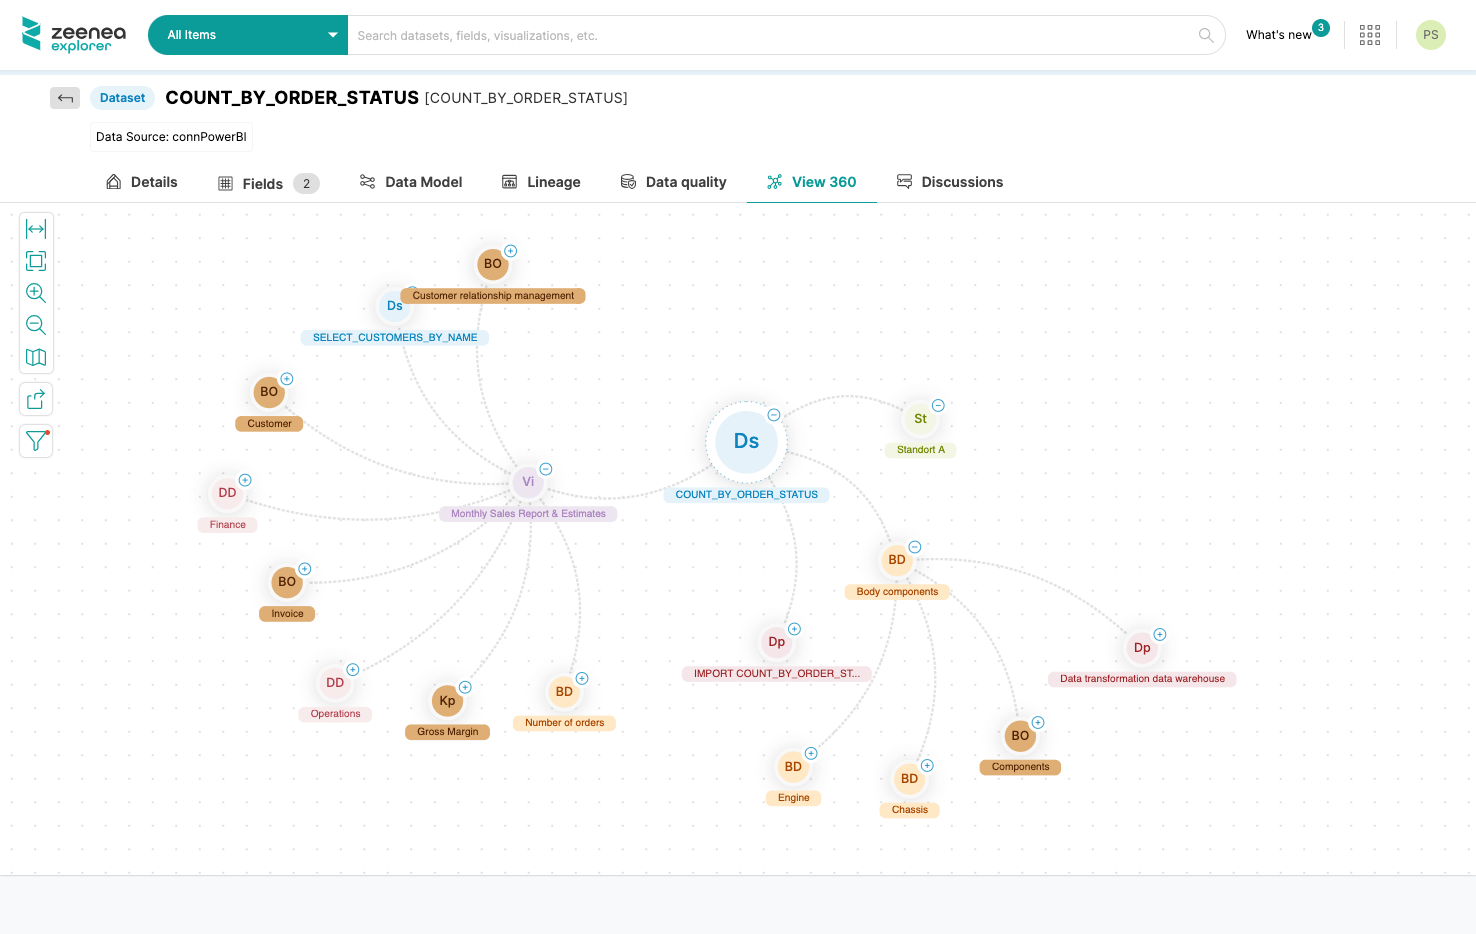
This component allows visualizing all relations of a particular Item with the other Items in the catalog, regardless of its type and to explore the graph of relations in an incremental way (semantic relations, between Datasets and Fields, etc.).
This component can be used on the Studio and the Explorer in the View 360 section.
Exploring the Graph
By default, the component only shows the direct relations of an Item. You can click on the “+/-” icon on the top-right of each Item to display the other relations of the selected Item.
Click on an Item to highlight its direct links and to display an overview of its documentation (description and properties).
Filters
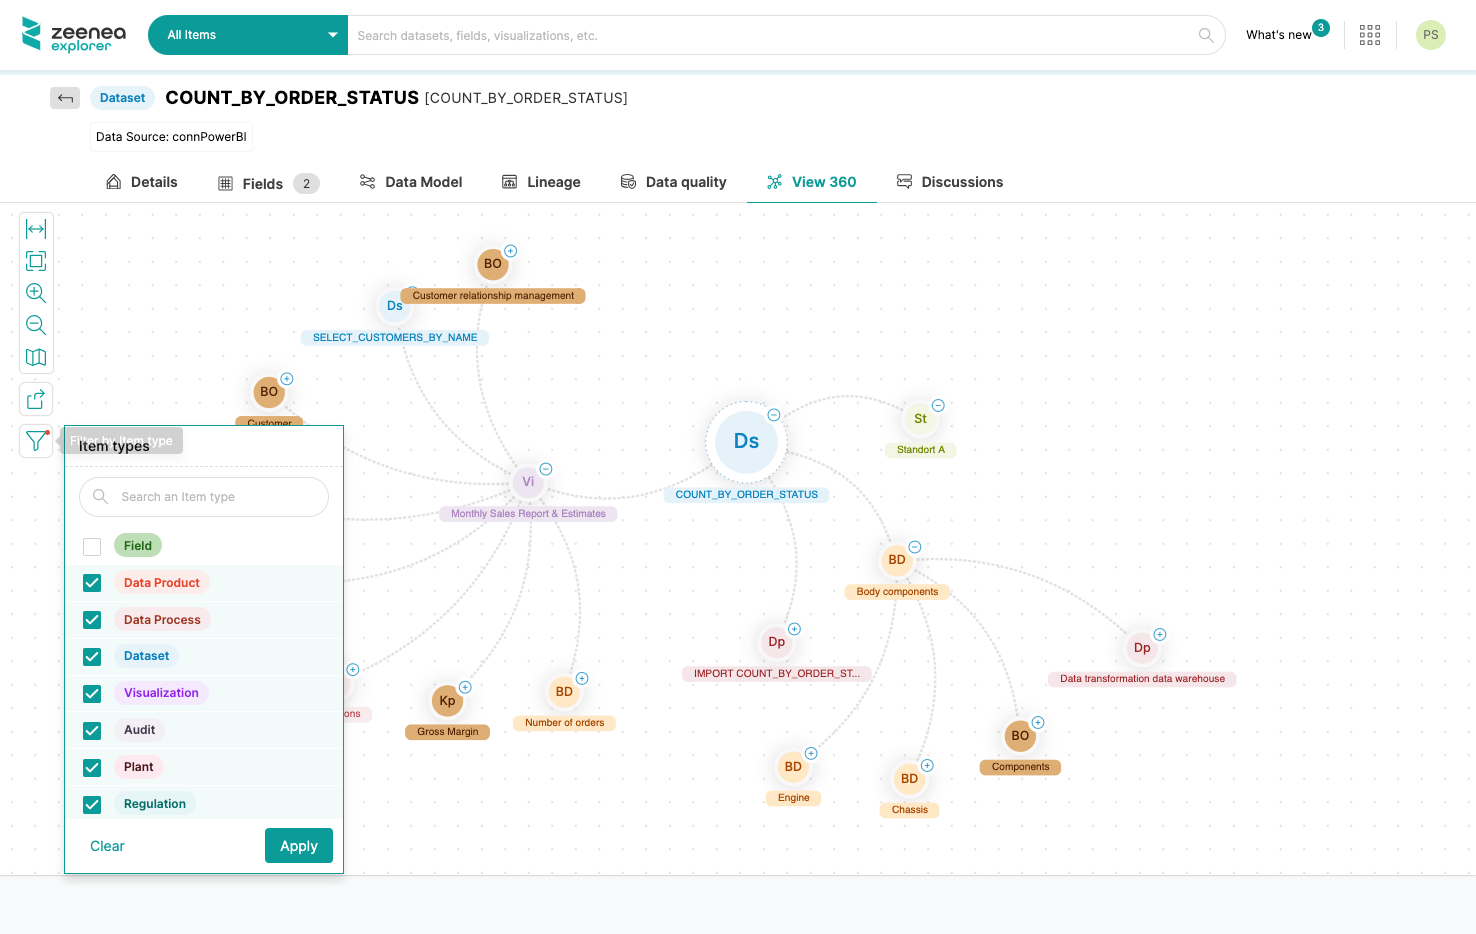
By default, dataset fields are hidden when opening the section: this is to make sure the graph is not too crowded.
You can display Fields or hide other types of Items thanks to the action button in the top right corner of the diagram.
Zoom features
At the bottom-right of the diagram, you will find some action buttons to adjust the display of the graph.
In particular, the “map” button allows you to navigate in the graph in an easier way.
Export
On the top-right, you will find a feature to download the diagram as a .PNG file.